Statistics
Retail operations offers four default statistics tables in the application. These tables are called: Dashboard, Sales Analysis, Sales Sales Detail, Billed Sales Detail, Supplier.
It can be proposed to add or modify the analysis tables on quote. The request must be documented to be studied by our team.
Settings
Our service team has access to different settings on the statistics according to the roles of the users created for the company. For each role, access to each of the tables and the type of data accessible can be configured according to three levels.
- Master franchise level: the user has a view of the data of all the company's stores (even if he does not have access to the other data of these stores)
- Manager level: the user has a view of the data of the stores to which he is assigned
- Salesperson level: the user has a view of his own data. He cannot see the data of other users.
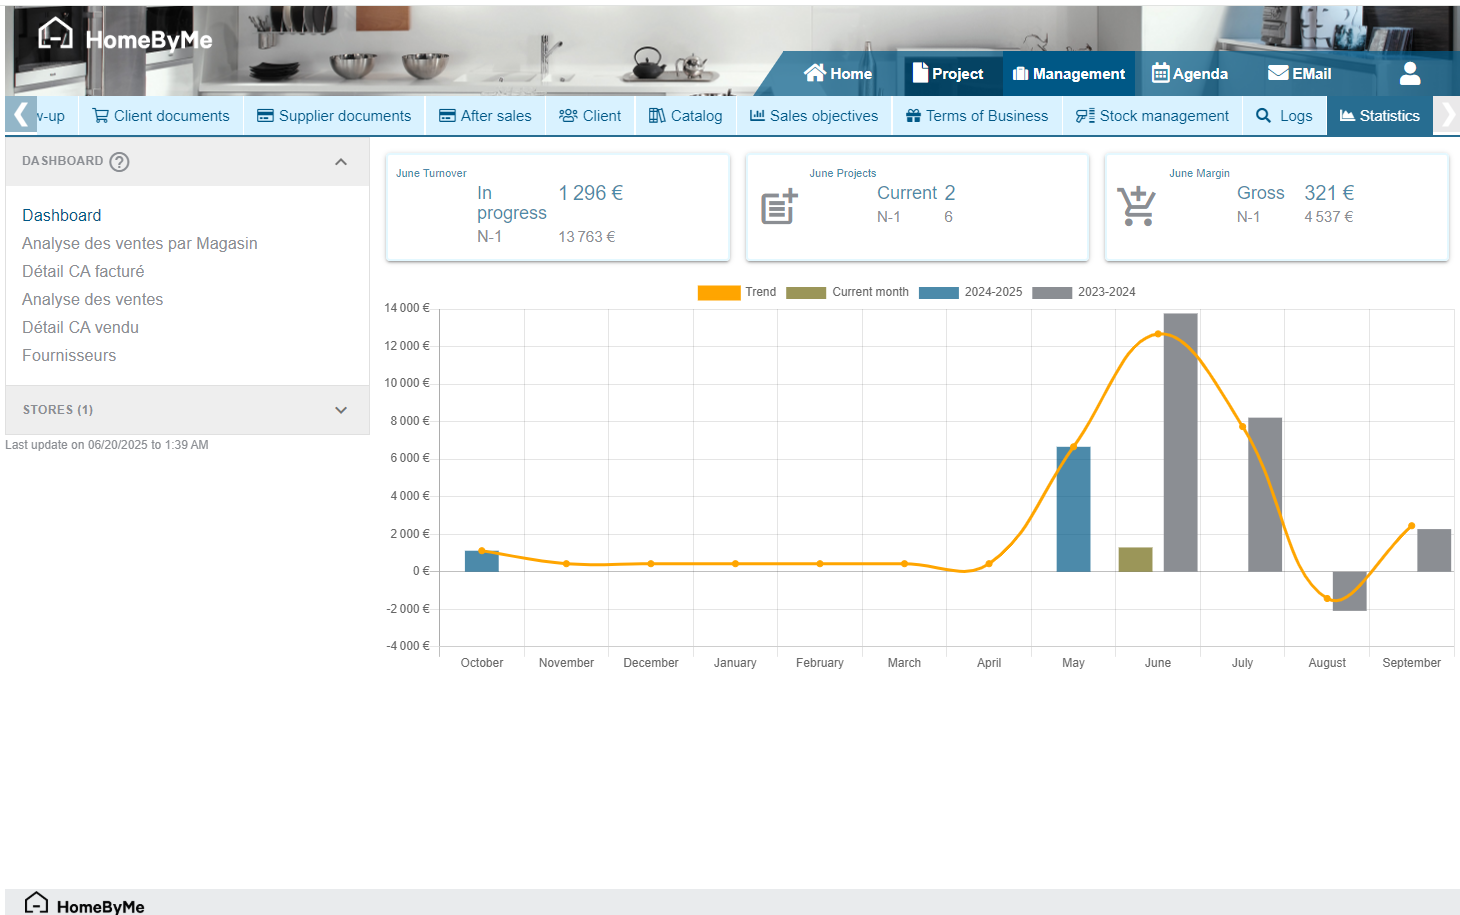
Dashboard
The Dashboard allows you to have a quick overview of the activity of one or more stores. It includes:
- The turnover achieved in the current month compared with the previous year
- The number of projects achieved in the current month compared with the previous year
- The gross margin value achieved in the current month compared with the previous year
- A graph with the vision of the turnover over a sliding year with always a vision of the three months to come.
- A trend curve allows you to project yourself over the three months to come according to the evolution of the current turnover.
This table can be filtered by store for users with access to several stores.
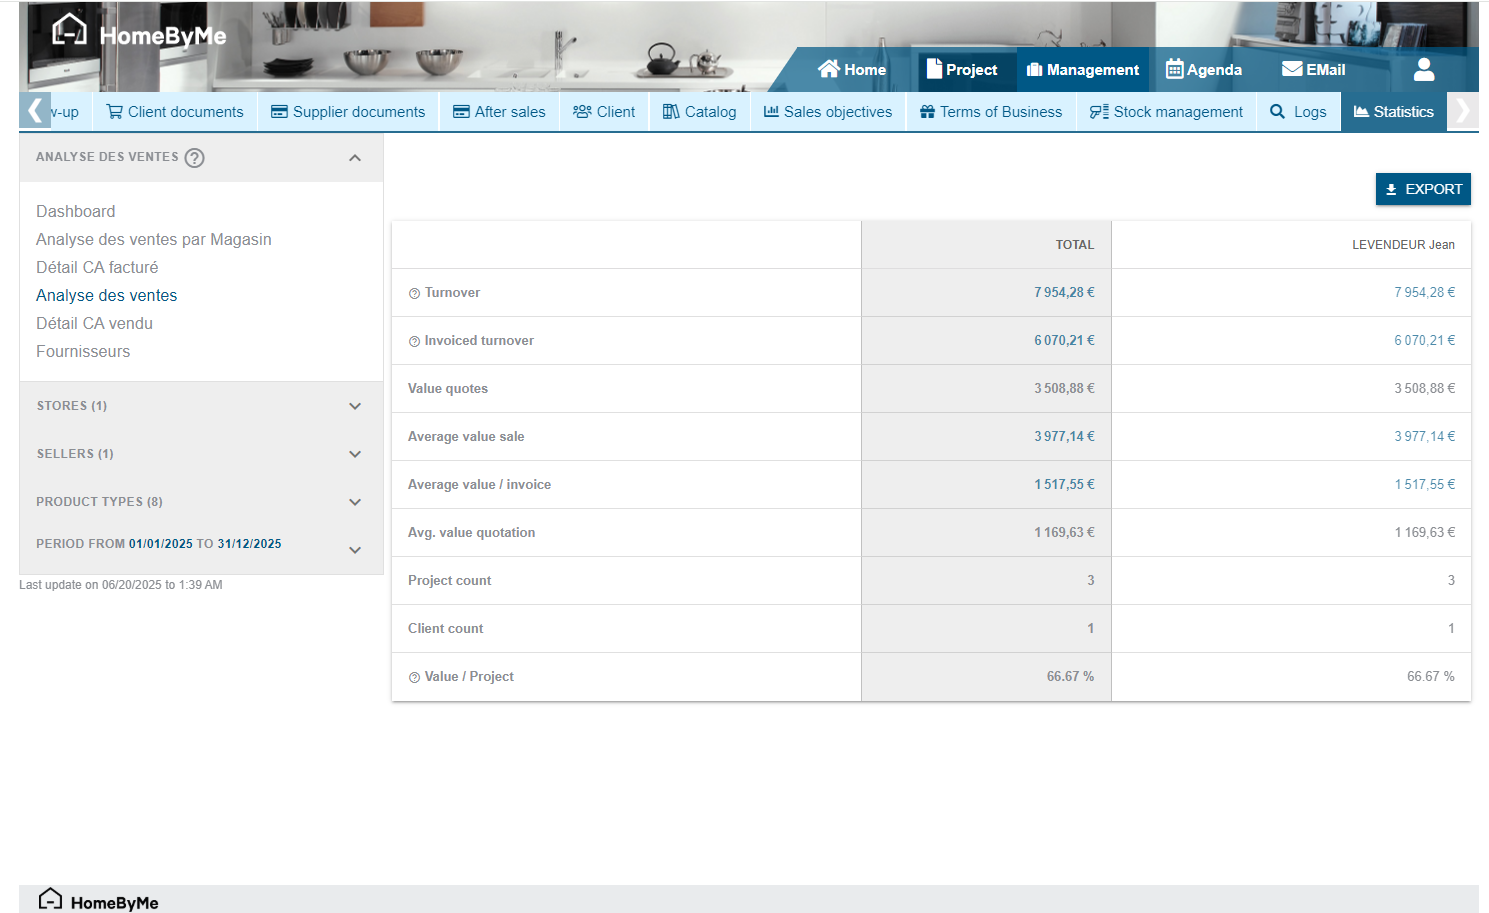
Sales analysis
Sales analysis is a summary table of the store's activity. It includes:
- The amount of sales turnover sold
- The amount of sales turnover invoiced
- The amount of sales turnover in quotes
- The average basket sold
- The average basket invoiced
- The average basket of quotes
- The number of projects created
- The number of customer contacts created
- The conversion rate (based on the number of projects)
This table can be filtered by store, seller, product type and date.
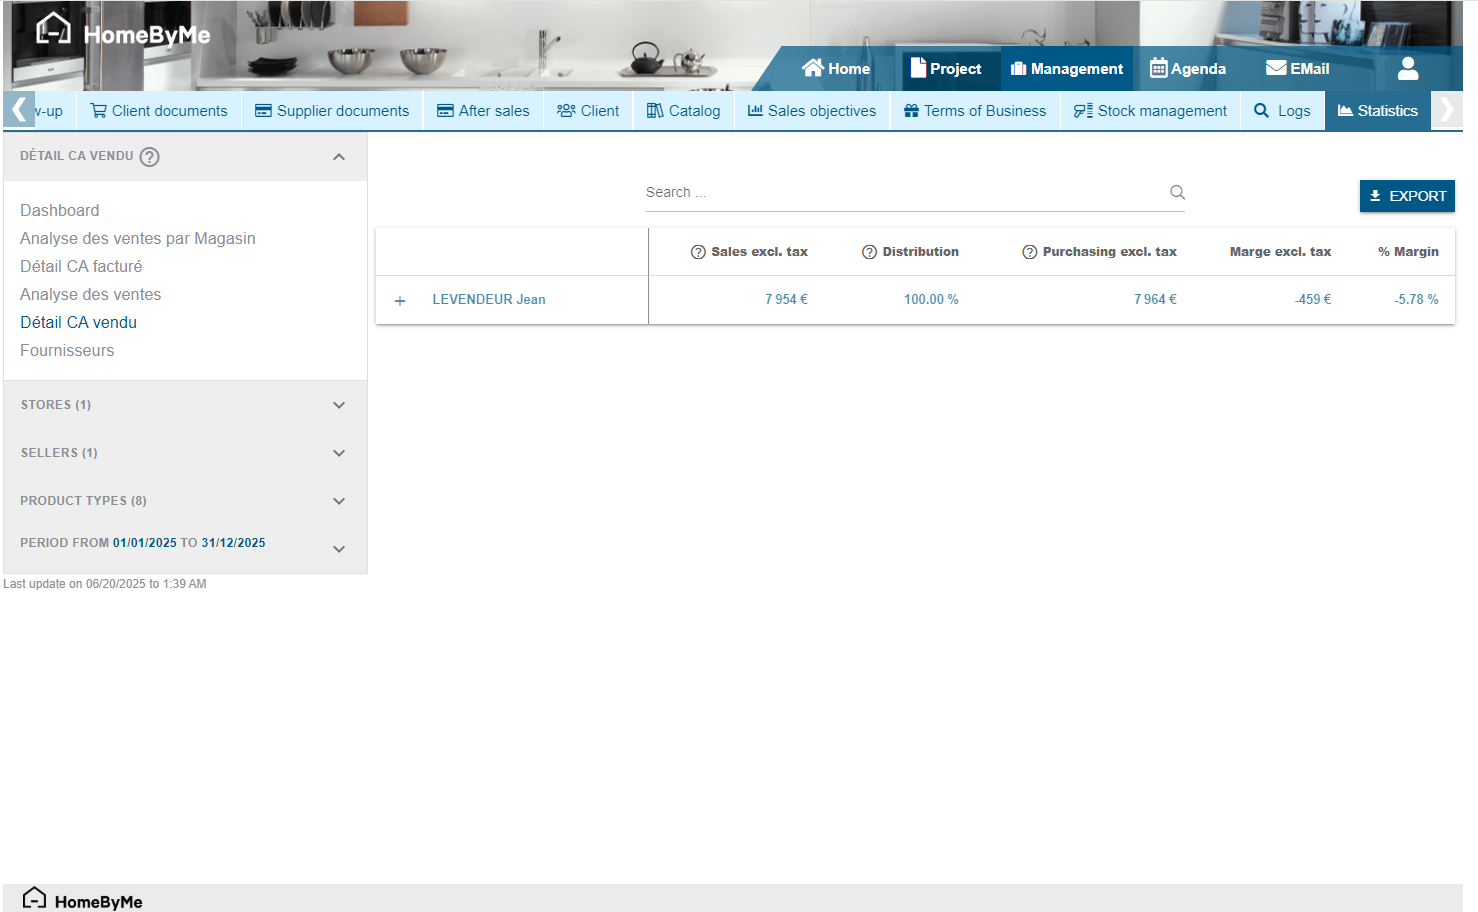
Detail of sales turnover sold
The breakdown of the turnover sold allows you to consult detailed information on the projects sold. The information accessible is:
- The name of the customer
- The name of the project
- The order number
- The details of the product groupings
For each of these levels of information, we find:
- The amount sold excluding taxes
- The theoretical purchase amount
- The gross margin value (on sale)
- The gross margin percentage
This table can be filtered by store, seller, product type and date.
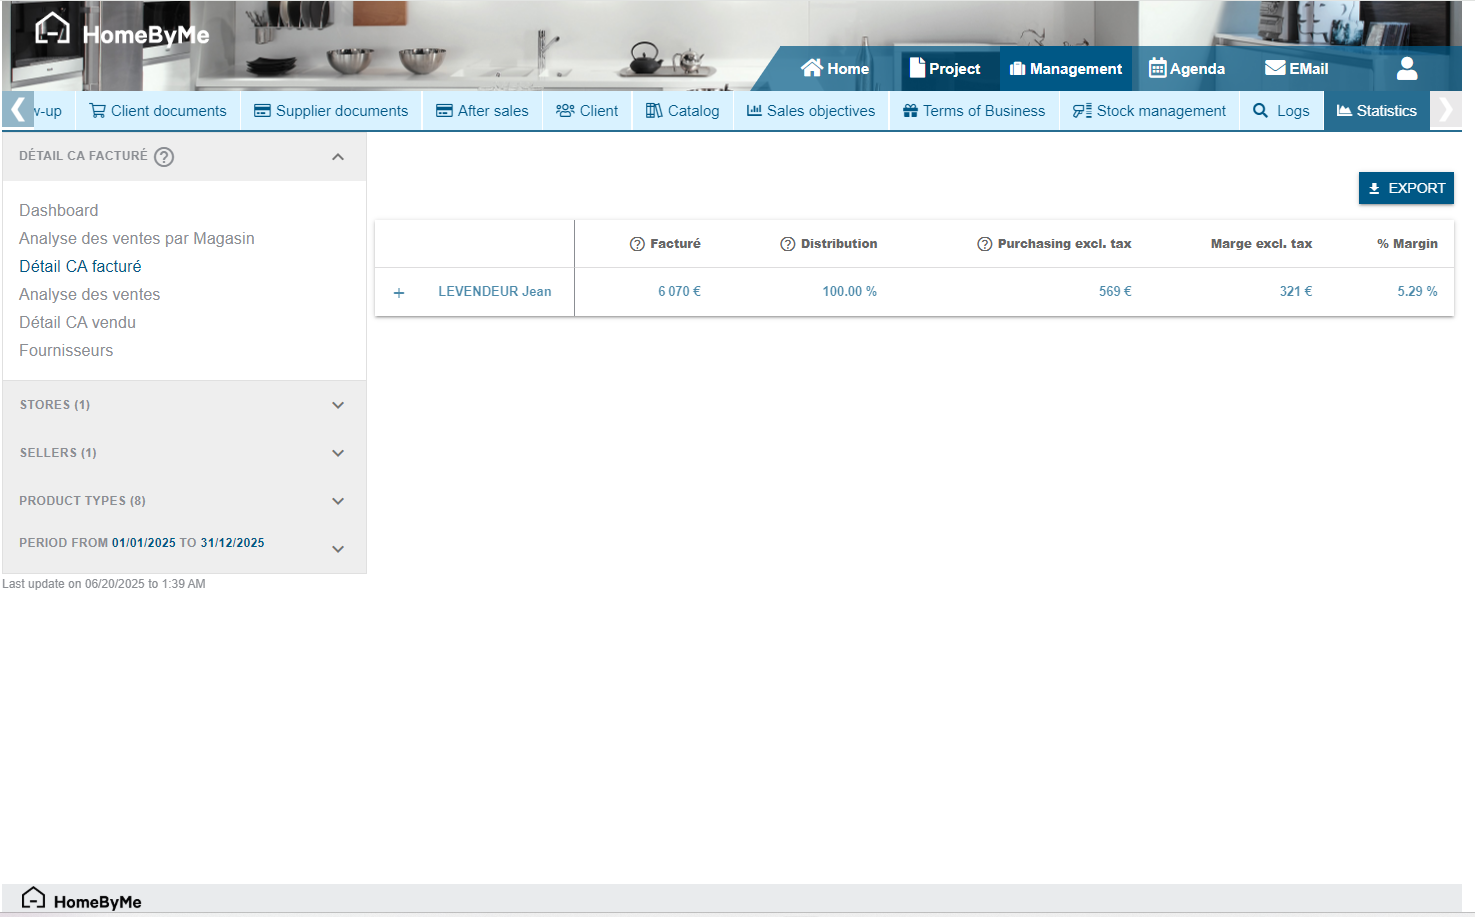
Details of invoiced turnover
The details of the invoiced turnover allow you to consult detailed information on the invoiced projects. The accessible information is:
- The name of the customer
- The name of the project
- The invoice number
- The details of the product groupings
For each of these levels of information, we find:
- The amount invoiced excluding taxes
- The theoretical purchase amount
This table can be filtered by store, seller, product type and date.
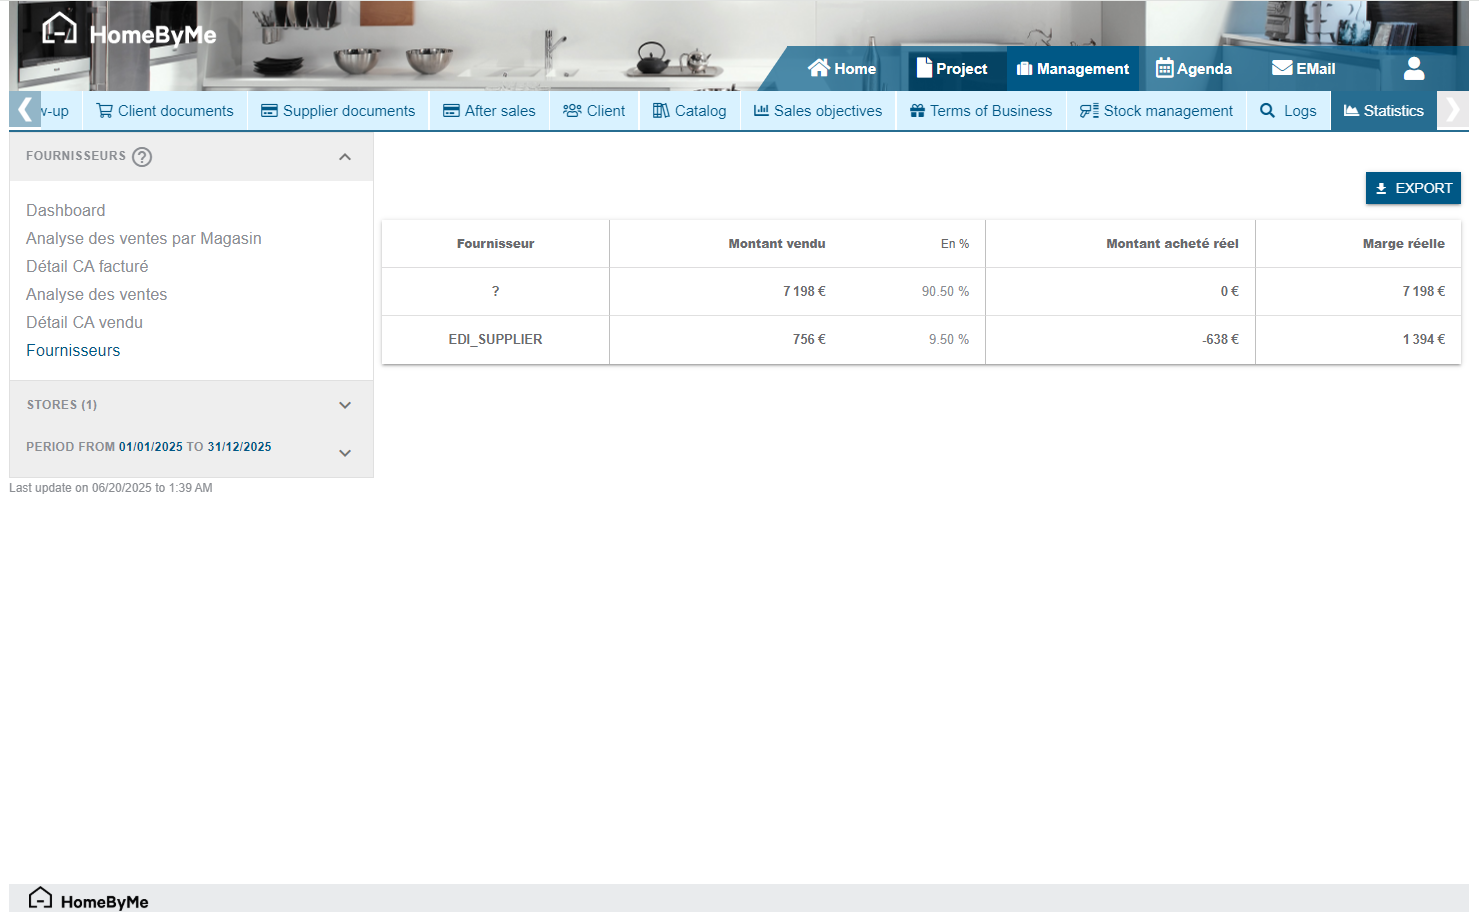
Suppliers
The "Suppliers" tracking table allows you to view the following information:
- Amount sold
- Amount purchased
- Margin value
- Margin percentage
Suppliers are sorted by amount sold (from most used to least used).
It is possible to filter the results by store and dates.